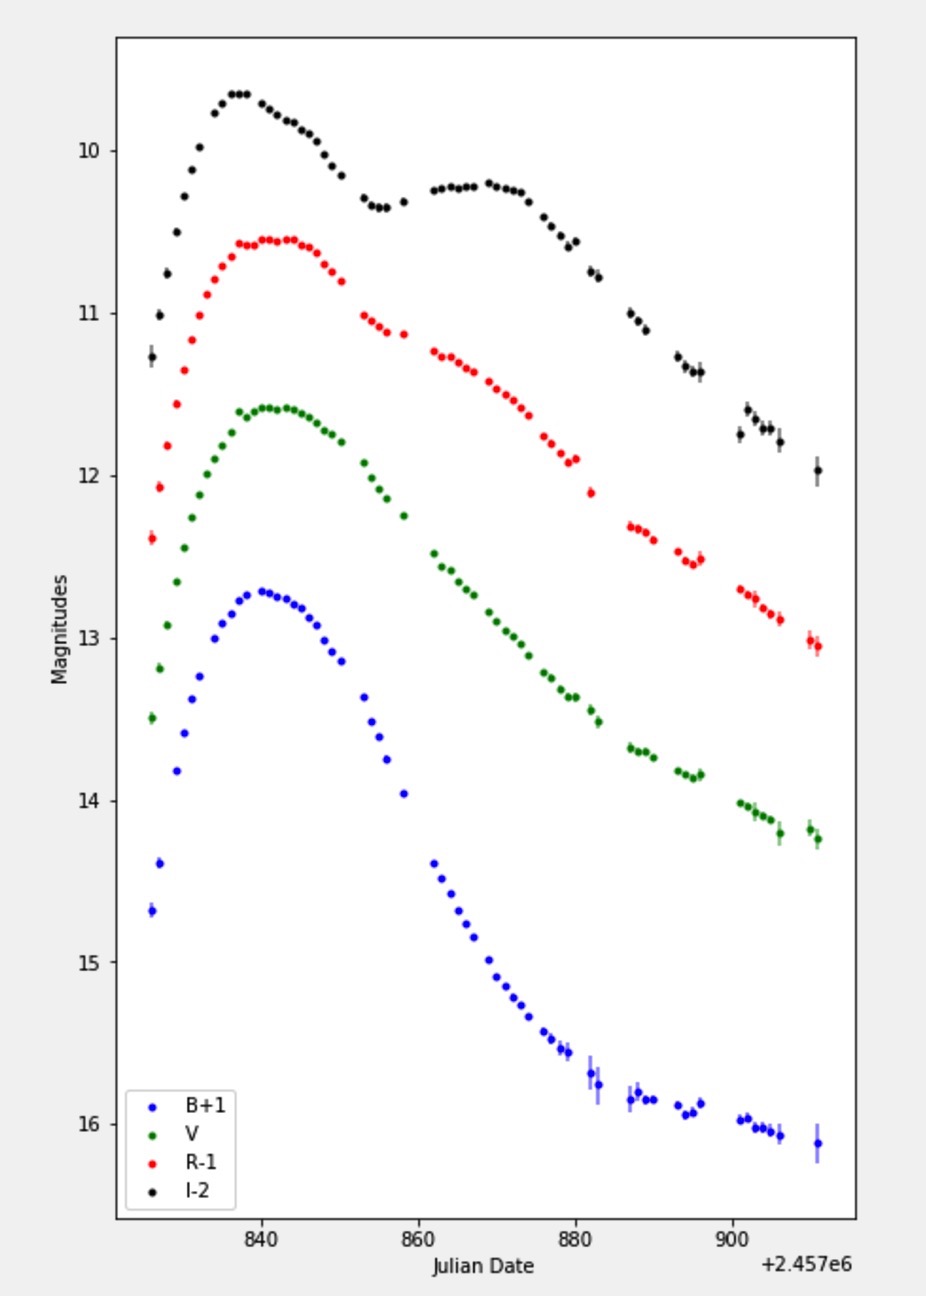
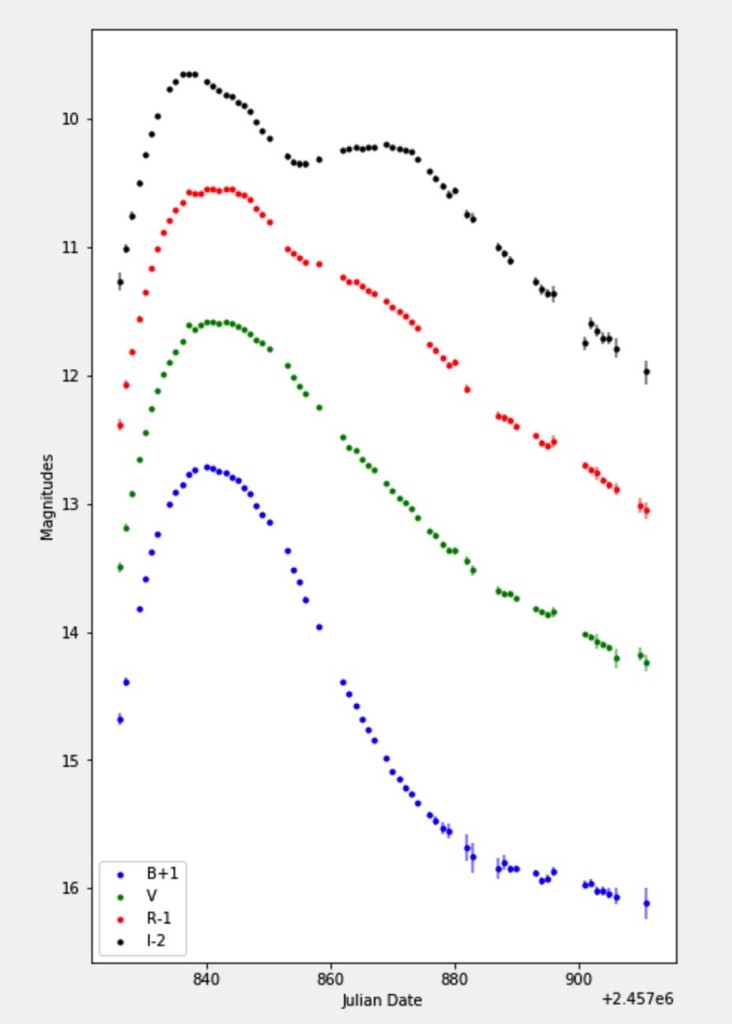
As our data from the NGC 5643 supernova continues to come in, we are building up an ever better light curve from our Supernova! The Type Ia supernova is caused by a white dwarf star collapsing and creating a cornucopia of new elements – Nickel, Iron, Cobalt, and also Gold, Platinum and other heavy elements. The explosion and death of the star seeds the galaxy with new life – in the form of a blast wave of enriched elements which speeds away from the explosion at a fraction of the speed of light. The evolution of the light curve follows several stages. The first stage includes a rapid increase in brightness which comes from the expansion of the supernova – which i the early phases has a luminosity that increases with R², as the supernova remains hot and dense and is unable to cool. As the supernova reaches maximum brightness, the expansion is met with a cooling that causes the supernova luminosity to level off; in all such explosions luminosity scales as R²×T^4, and at maximum brightness these factors tend to offset each other. After maximum brightness, the radioactive decay products in the supernova begin to inject gamma rays into the cloud, heating it up and extending the brightness of the supernova into what is sometimes called a “shoulder” of the light curve. The half lives of radioactive Nickel and Cobalt are fixed, and provide an extension of the light curve for several months before a stable isotope of Iron is produced.
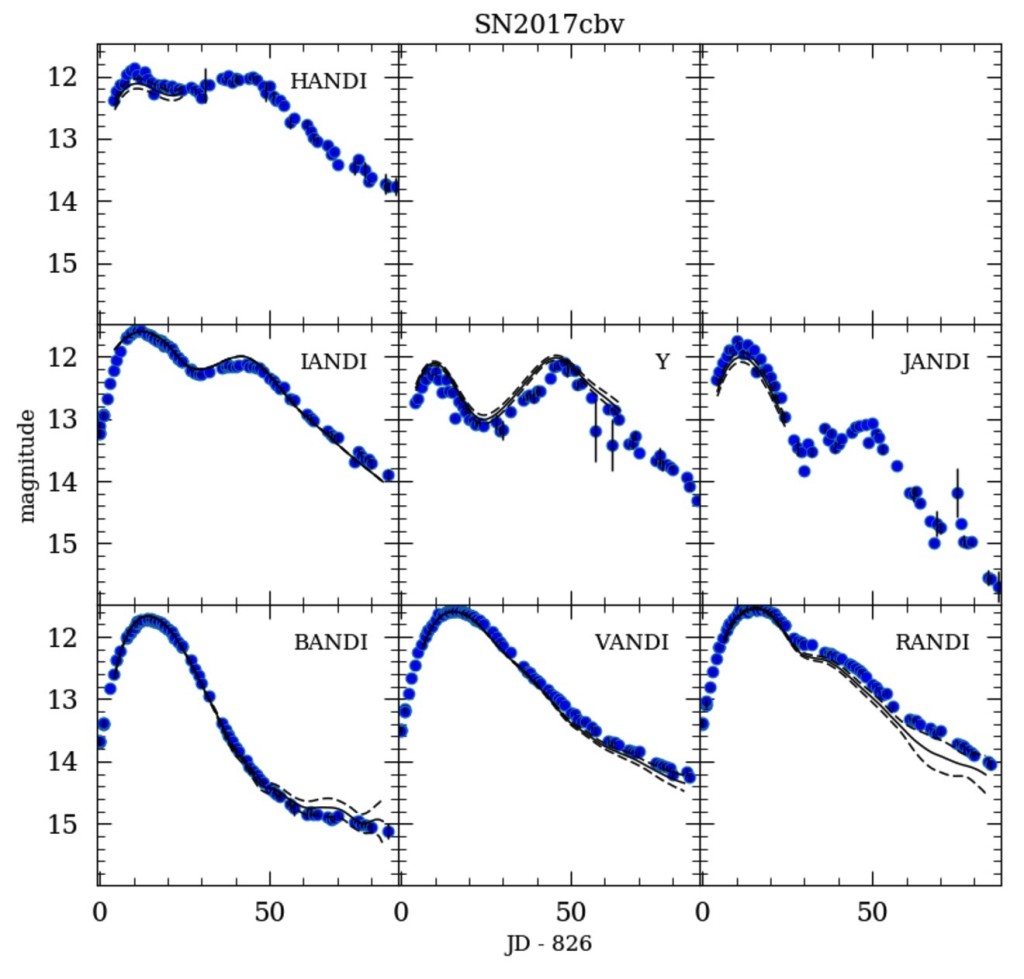
With our telescope in Chile and our crew of Yale-NUS students, we have built a very capable group for studying supernovae. The students, Rohan Naidu (Yale-NUS ’17), Jerrick Wee, Joanna Wang, and Nilotpal Chakraborty (Yale-NUS ’19) have worked together very well and each have contributed toward our research paper which is being written now at Caltech. Our light curve has continued to improve and we now have combined observations in the BVRI and YJHK filters – giving a wide range of observations from blue optical light all the way to the infrared. These combinations of colors allow us to measure the temperature of the supernova, and to detect the various phases of radioactive decay and cooling in the supernova. When combined with a mathematical model of the expansion, we can also learn about the amount of dust and absorption in the galaxy and foreground, and more precisely measure the peak luminosity and initial detonation time of the supernova.
We are working with several of the amazing Carnegie scientists in Pasadena during June and July to prepare a paper on the object. We are grateful to Ben Shappee (one of the leaders of the ASASSN project, and now Carnegie/Princeton/Hubble Fellow), Rachael Beaton (Carnegie/Princeton/Hubble Fellow) for their help interpreting our data and guiding our work. The Carnegie Observatories also have created the amazing Las Campanas Remote Observatory – and through Michael Long and the OCIW crew our class at Yale-NUS College was able to obtain data from the supernova during class time in Singapore to help contribute to their light curve that they are separately publishing. Our group of students, along with the ZTF Caltech Summer Undergraduate Astronomy Institute, was able to share some of the summer with Carnegie Observatories as we visited their historic center on Santa Barbara street, and merged our undergraduate researchers together in visits to Palomar Observatory and to the Caltech atheneum. You can see more about this joint effort at our ZTF Undergraduate institute web site – http://ztf.commons.yale-nus.edu.sg/
We are using the modelling packages known as SNCOSMOS and SNooPY to make these models, and are getting some great results on this exciting object!


